Weather, Storm Surges, and Tropical Impacts
Finding the right data for incoming weather events and how they are impacting you can be difficult given the blitz of incorrect information. Here you will find links to the data and trends so you can make educated decisions about what to do. That said, listen to and obey your local authorities as you see fit.
No statements on this website are construed to protect life or property, and unfortunately you are on your own for that.
Storm Tracks and Waves
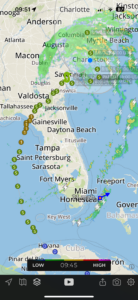
Wave Height & Direction (SECOORA)

A Note on Datums (MLLW, MLW, NAVD)
A note about DATUMs, which causes great confusion for readers who look at the NOAA websites, rando university sites, and other data portals. As many of you are aware, Mean Low Water (MLW), Mean Lower Low Water (MLLW), North American Vertical Datum (NAVD) of 1988 and any of the other datums, are all different measures of elevation, and we can’t figure out what datum is being presented, and that is critical for understanding storm surges. Frequently, storm surges are listed as number of feet above the current tide. When talking about inundation, or the water level over the ground, the models will predict how much water will be above the land surface at a specific location. Terrestrial measurements frequently use NAVD88, which is what we get from LiDAR surveying and other methods after converting from the satellite WGS1984 (see here for more discussion). In the water, as in a boat coming into a harbor or navigating the waters, we want to know where we are with respect to MLW…that is, what is the least amount of water under our keel so we don’t ground.
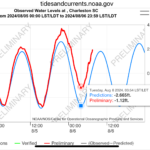
Here in Charleston, I am often running around the harbor edge mapping the water level with an RTK-GPS (good to about 2-cm vertical measurements), and then comparing those data with the gauge height in Charleston AND the local LiDAR data. We’ve been doing this for years for ‘king tides’ and other phenomena, but before, during, and after storms, the measurements seem more important. For real-time data, you can see the live Predictions (blue) and Preliminary (red) levels, on the plot of the water levels. To the left axis, you can see the datum used: often it starts with Height in Feet (MLLW). If you scroll down a bit, you can change the axes…and they run vertical datum corrections for you! Let me say, that is great and saves a lot of time!!! Change the Units to Meters, Timezone to LST/LDT, and Datum to NAVD, and voila! Tide levels are now in the same value range as the terrestiral measurements created from the LiDAR data. There is a good graphic of the datums for Charleston Harbor tidal gauge here:
…a sneaky link to my old post from 2017 — lots of good information, but lots of dead links, too…
Water Level Plot