
Storms
Finding good data for an incoming storm is hard in a blitz of bad information. This page explains the one thing that confuses almost everyone, which datum a water level is measured from, and points to the sources worth watching.
Nothing here is a warning or a forecast, and nothing on this site protects life or property. Listen to your local authorities.
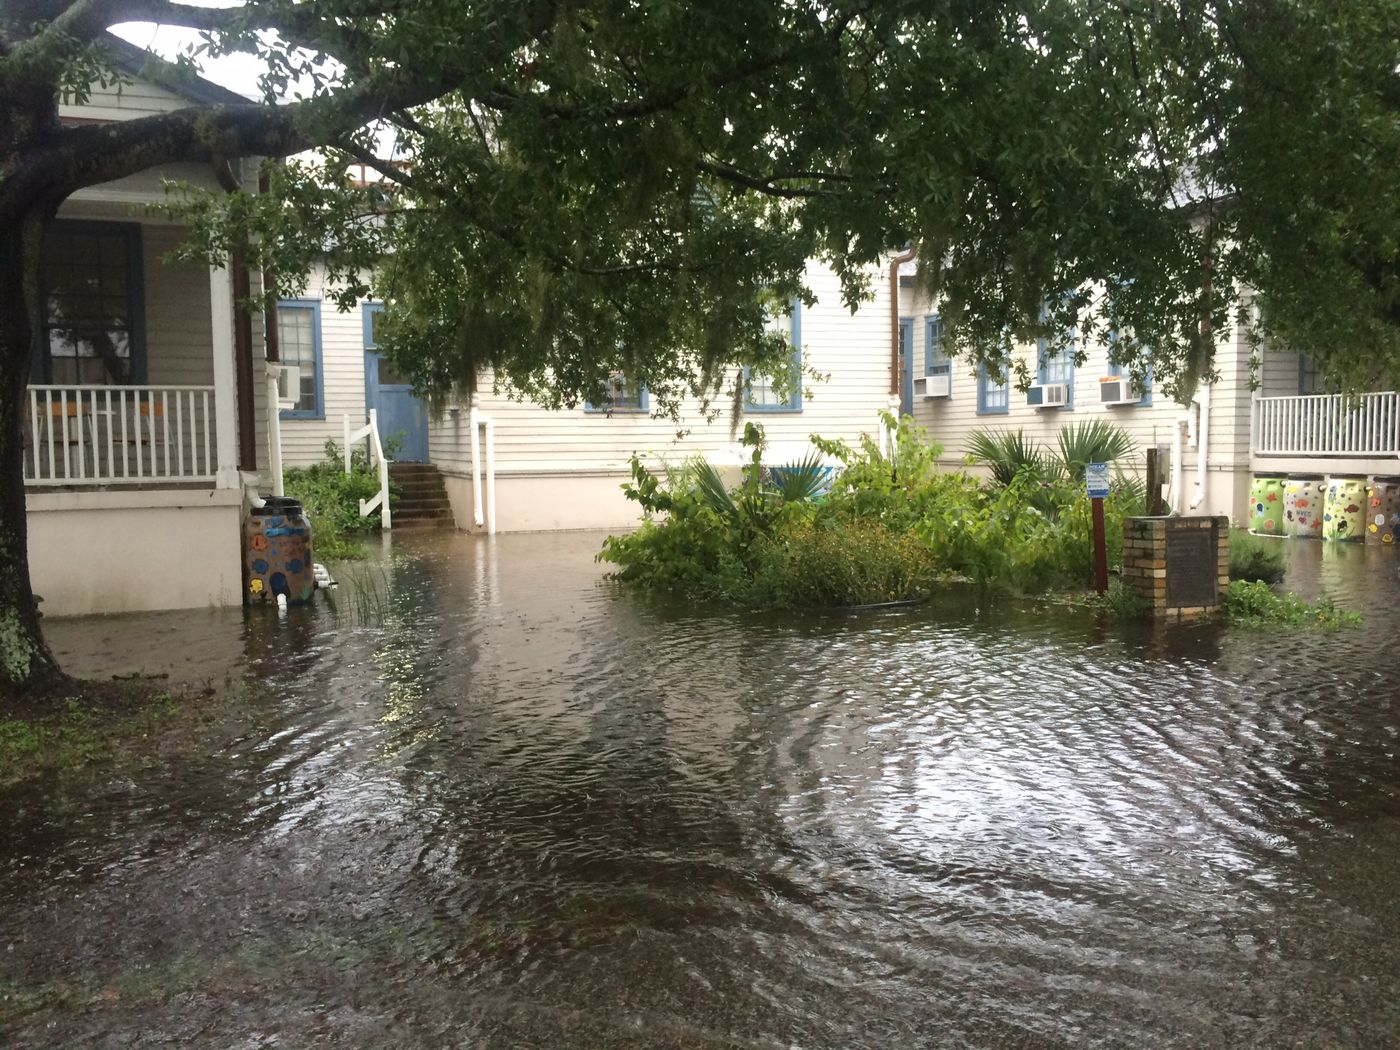
Live water levels
Earth Access FloodNet shows live, measured water levels from NOAA tide gauges, USGS stream gauges and community stations across the Southeast, switchable between NAVD88 and MLLW, over the last day, three days or week.
A note on datums: MLLW, MLW and NAVD88
Mean Lower Low Water (MLLW), Mean Low Water (MLW) and the North American Vertical Datum of 1988 (NAVD88) are all different zero points for elevation. The same water surface can read several feet apart depending on which one a website uses, and often it doesn’t say. That matters most in a storm.
- Storm surge is usually reported as feet above the normal tide.
- Inundation, the depth of water over the ground, is what flood models predict for a place.
- Land elevations, from LiDAR and survey-grade GPS, are usually given in NAVD88 (converted from the satellite WGS84 frame).
- On the water, charts use MLLW: the least water you can expect under the keel.
To compare a tide gauge with the ground, put both in the same datum. NOAA’s water-level pages will do the conversion: set Datum to NAVD and Units to meters, and the gauge reads in the same terms as the LiDAR. NOAA publishes the full set of datums for the Charleston Harbor gauge.
We check this on the ground: mapping the water’s edge around Charleston Harbor with RTK-GPS (good to about 2 cm vertically) and comparing it with the Charleston gauge and the local LiDAR, for king tides and before, during and after storms.
Storm tracks and waves
- National Hurricane Center: official tracks, cones and advisories
- National Data Buoy Center: offshore buoys, including 41004, Edisto, southeast of Charleston
- SECOORA: regional ocean observing for the Southeast
Raw data
- NOAA Tides & Currents: the Charleston gauge, station 8665530
- NOAA CO-OPS data API: every gauge, every datum, machine-readable